 noahmagill.com
 Elastic Defend Session View: Terminal Replay on Linux
Elastic Defend is Elastic’s EDR built on top of their observability agent. What originally started as an integration for security turned into a full blown, feature filled, and comprehensive security solution that competes with big name brands. See the endpoint integration docs for more.
Elastic Defend provides endpoint security capabilities including prevention, detection, investigation, and response for Windows, macOS, and Linux hosts. It protects endpoints while collecting high-fidelity system telemetry.
Elastic Defend differs from a traditional EDR in quite a few ways:
- No per-endpoint pricing
- Detection logic largely open sourced (yara rules, on endpoint rules, etc), see the protections-artifacts repo
I have personally used Elastic’s EDR solution many times and have been largely happy with it.
Contents
Elastic Defend Setup
If you want to try this out, you can go to their website at elastic.co and click “free trial” on the top right corner. This is a 14 day trial. It defaults to their new serverless setup so you do not have to worry about nodes, node type, node allocation, etc. Perfect for testing out this solution.
Once you have a cluster that you can access, head to cloud.elastic.co. From there you can click into your cluster by locating it and clicking “open”.

From there, you want to head to more -> assets -> policies. Go ahead and create a new agent policy.
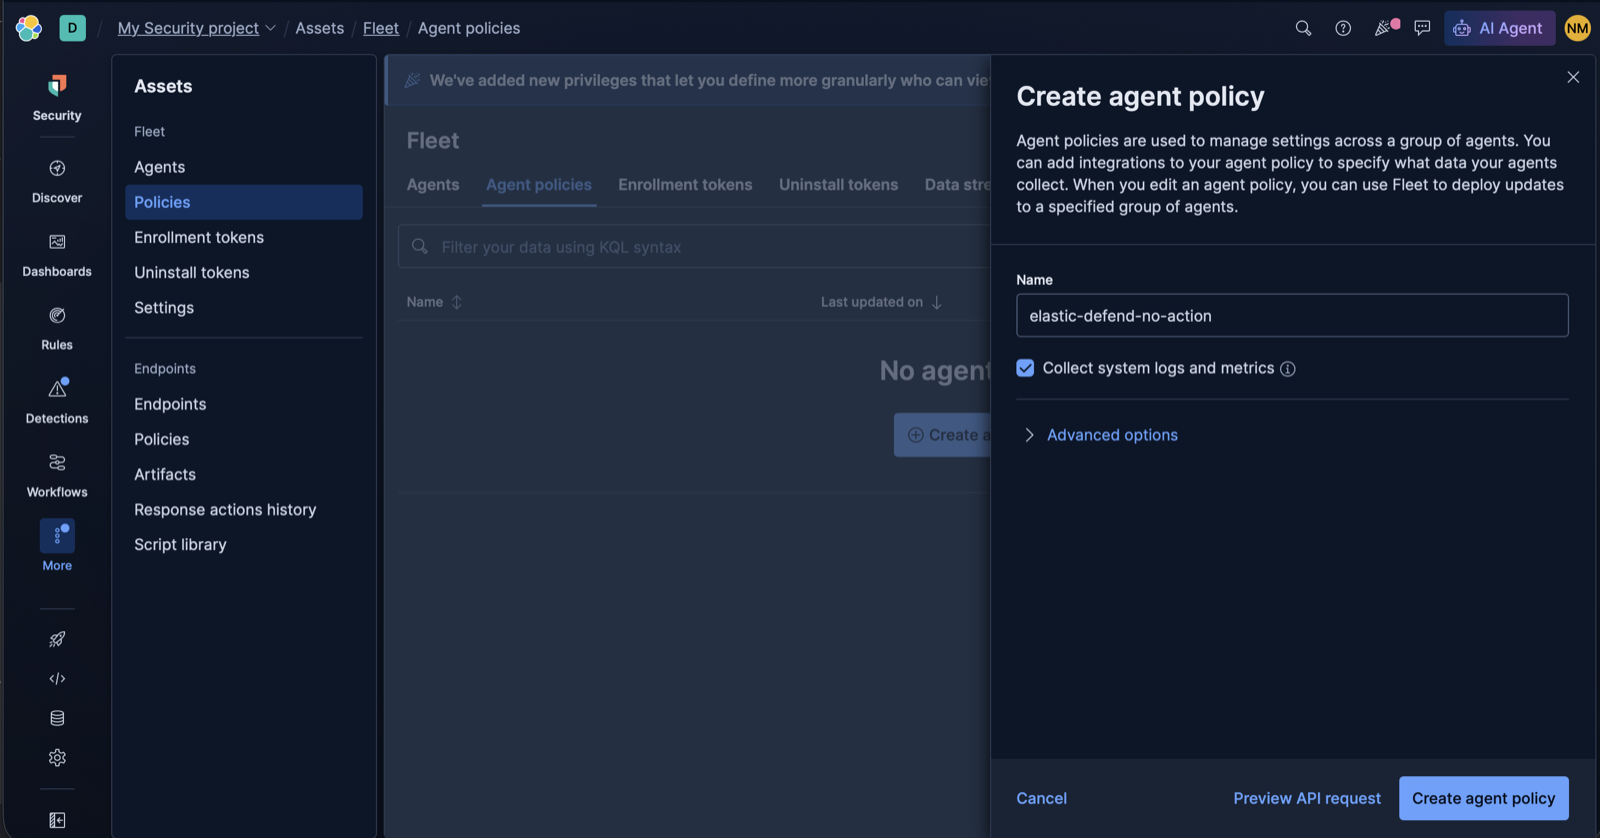
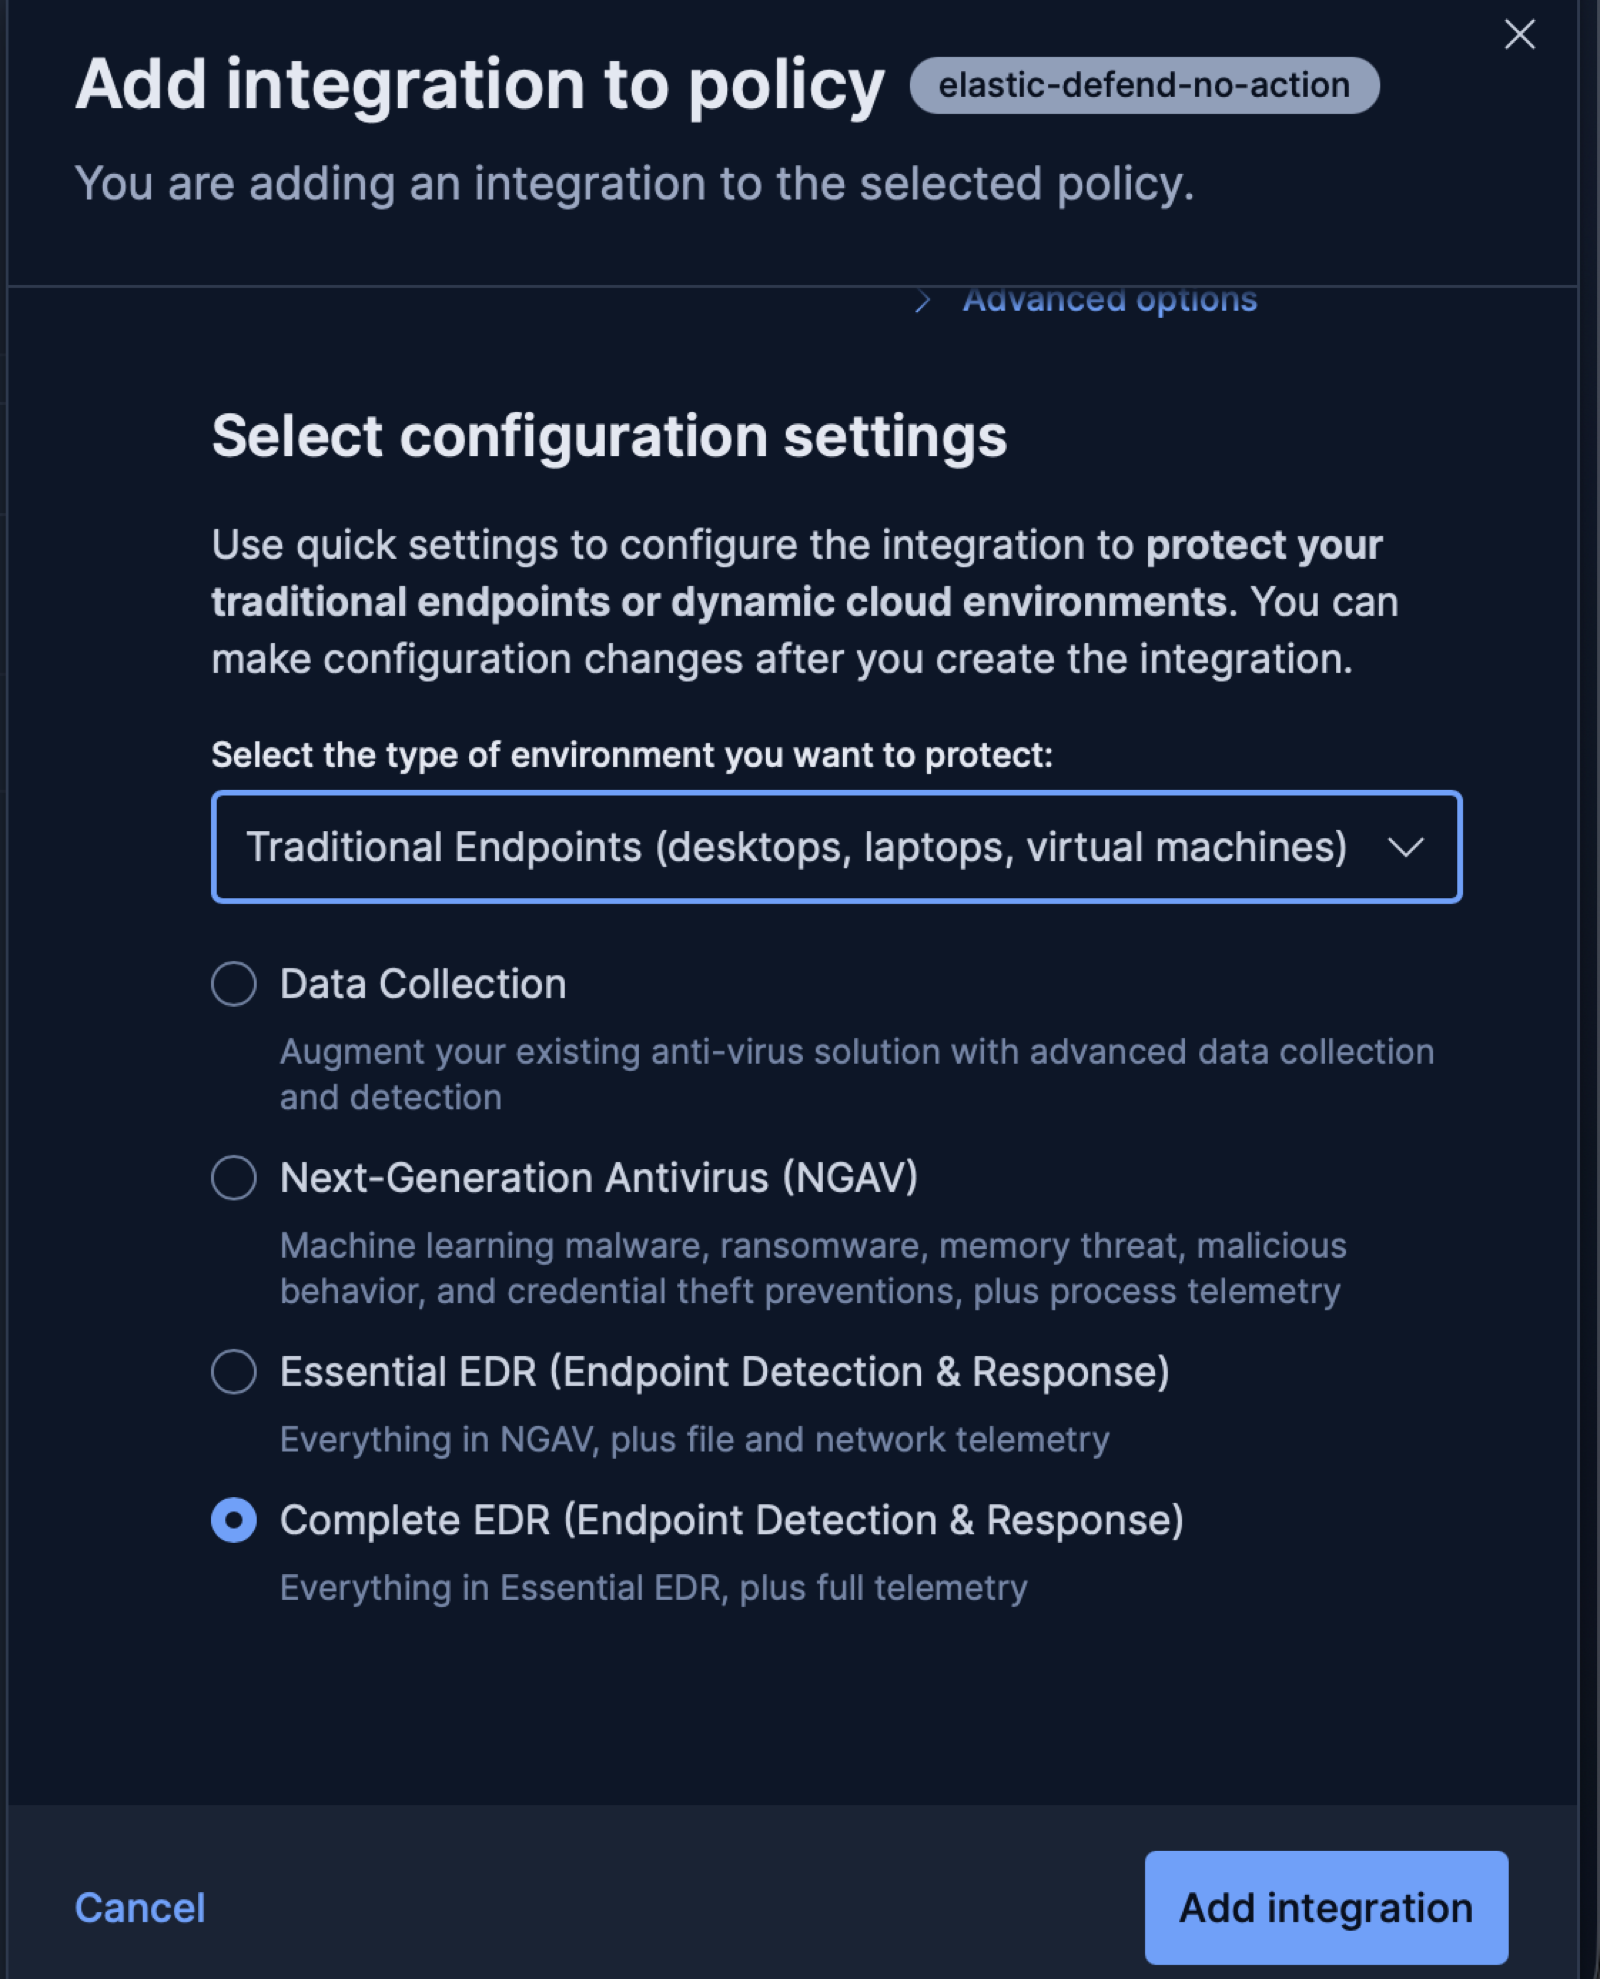
After that, you want to navigate to that policy, and click add integration. From there select the Defend Integration, and then ensure it is set to “Complete EDR”.
After that, head back to the policy, the integration you just added, and click edit. I personally went through the settings and changed “prevent” to “detect” for most of the options. This is just because this was a lab environment. My personal recommendation is to keep it in detect mode until you can verify it will not take any adverse reactions, and then follow up with a plan to promote to prevent.
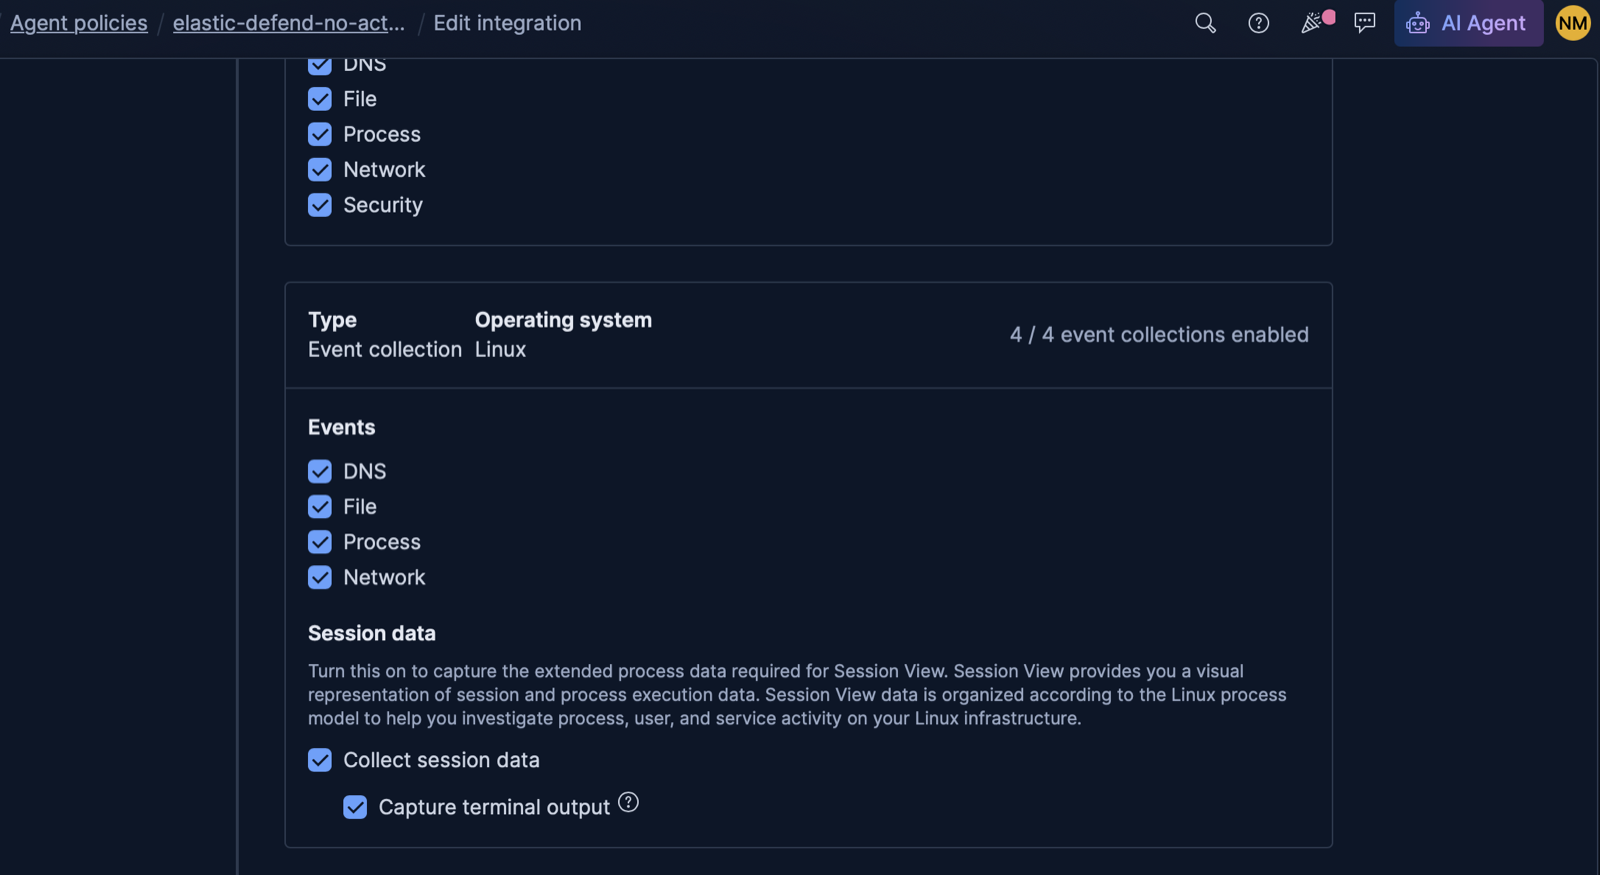
Then at the bottom of the integration, it is important that this session data is turned on as well as “capture terminal output”. This uses eBPF logic to capture all ‘tty_write’ sessions and keep them for playback.
After that head back to the policy, and click add agent. Change the install instructions to be relevant to your architecture (x64, aarch64, etc). Grab the install command, and then run on a Linux host.
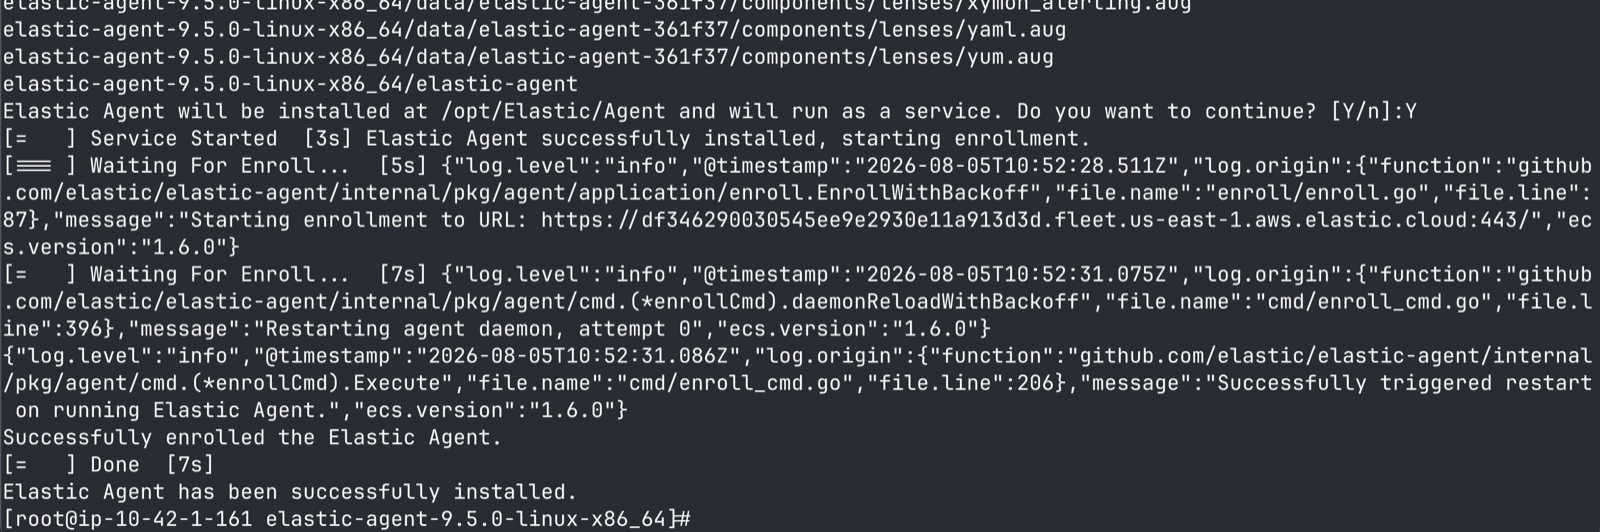
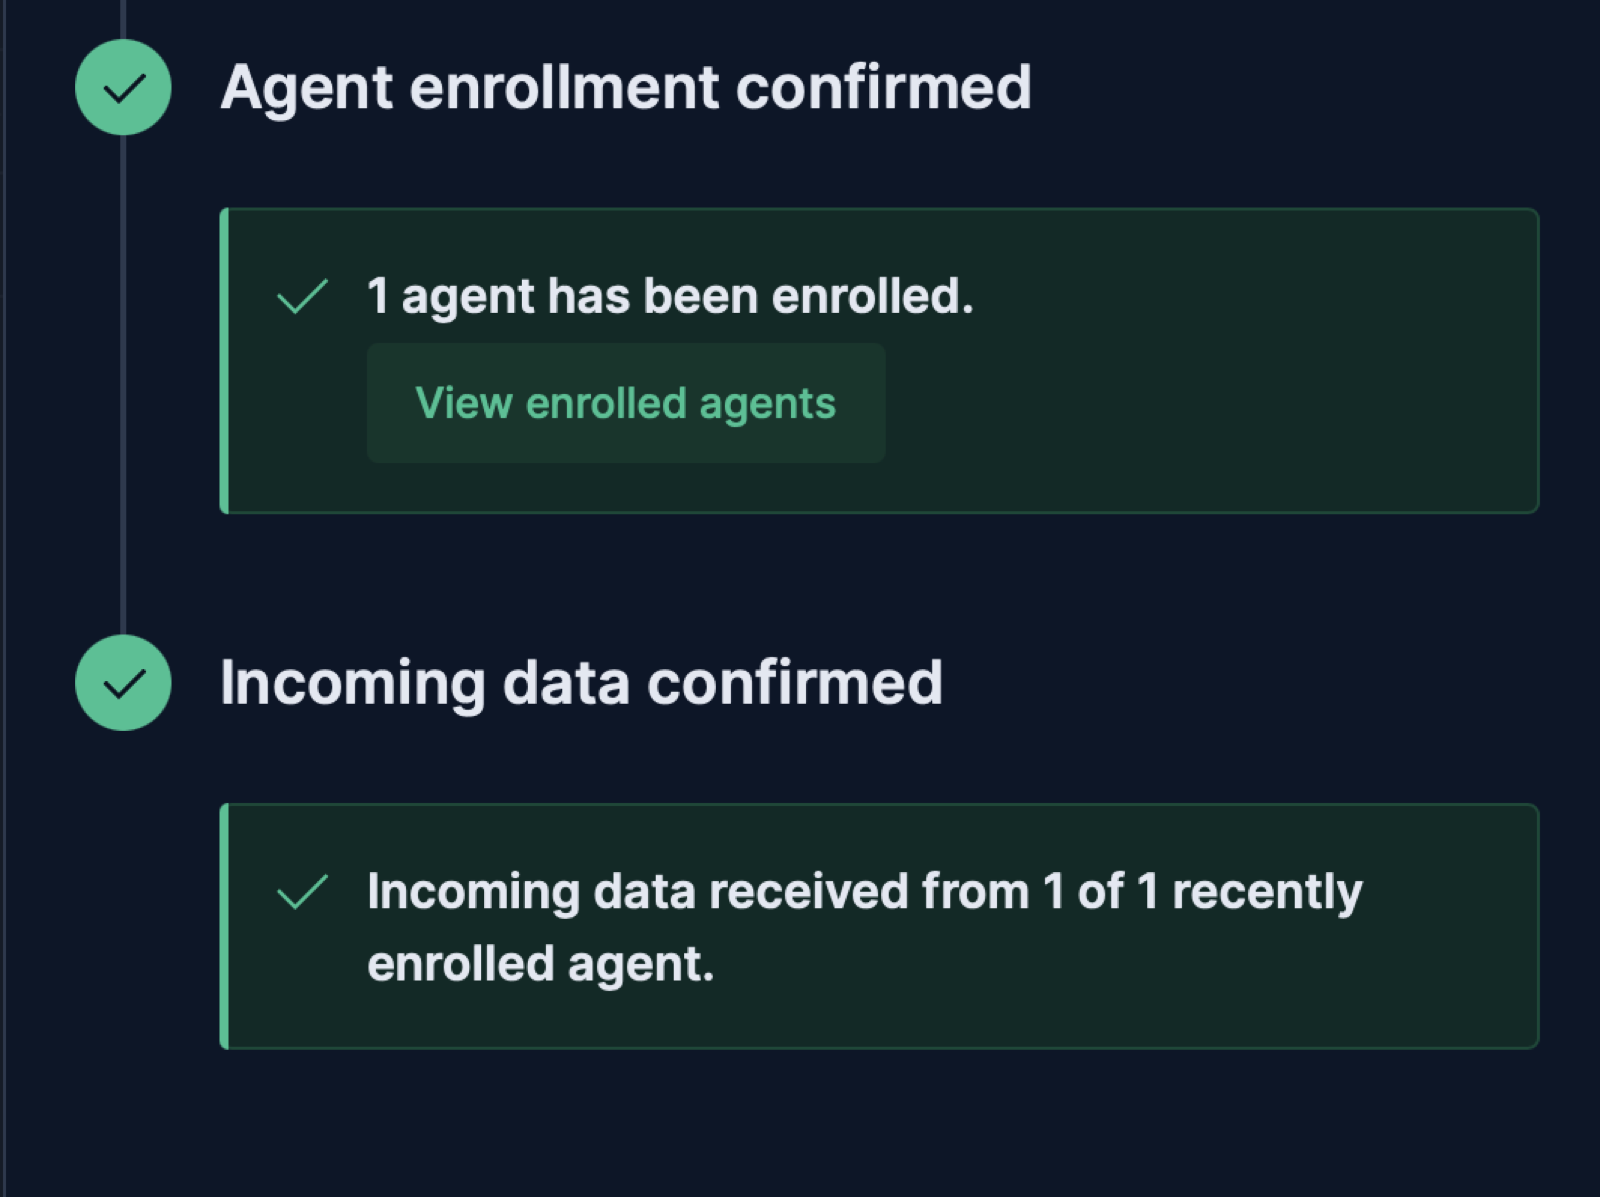
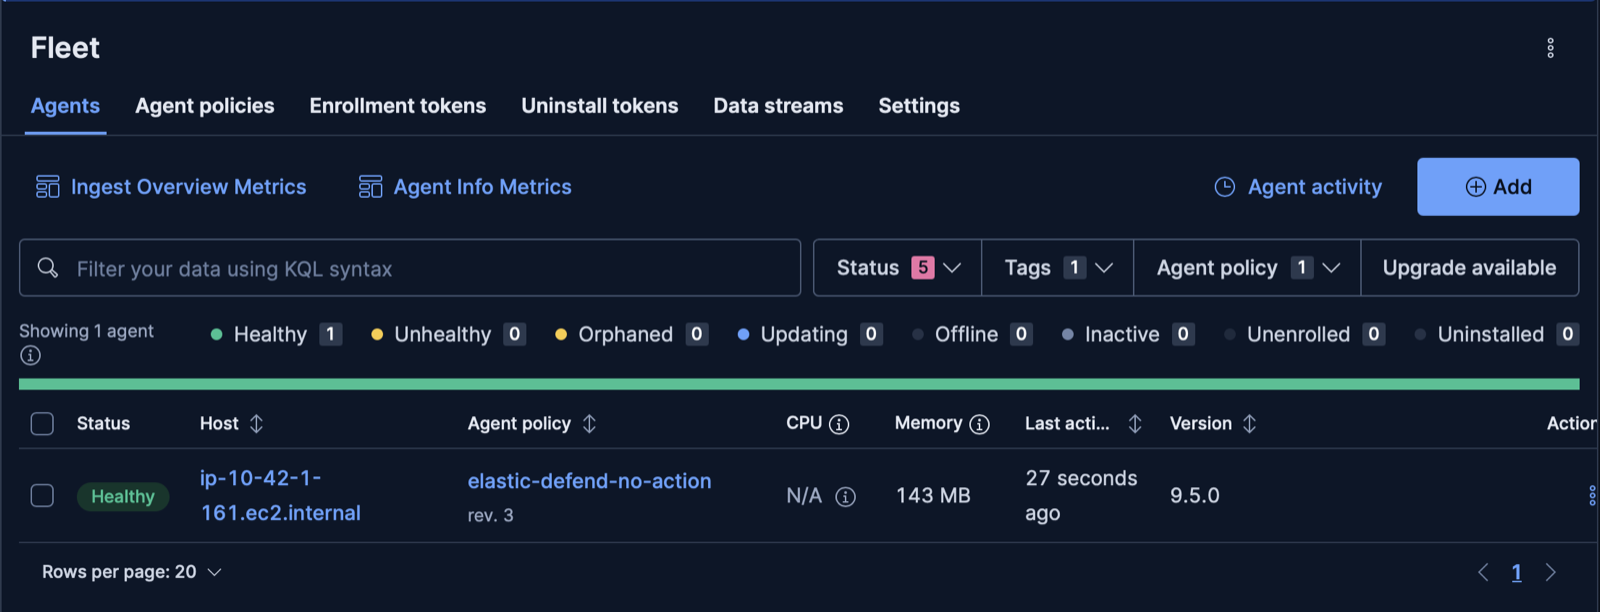
The newly registered host should appear under the “agents” tab.
Testing Session View/Replay + Simulated Attack
I logged into the host where the Elastic agent was on post install, escalated to root via sudo su, installed netcat, and then ran a bind shell nc -nlvp 9001 -e /bin/sh. This is insanely simplistic but enough to demo Elastic’s security features.
Before I did this I went into the security panel and installed all of the detection rules. I think this rule that triggered is just in the Elastic Defend Integration Rule, which effectively is a catch all rule for any alerts that stem up from the agent themselves, rather than the SIEM (Elastic) catching it after the fact.
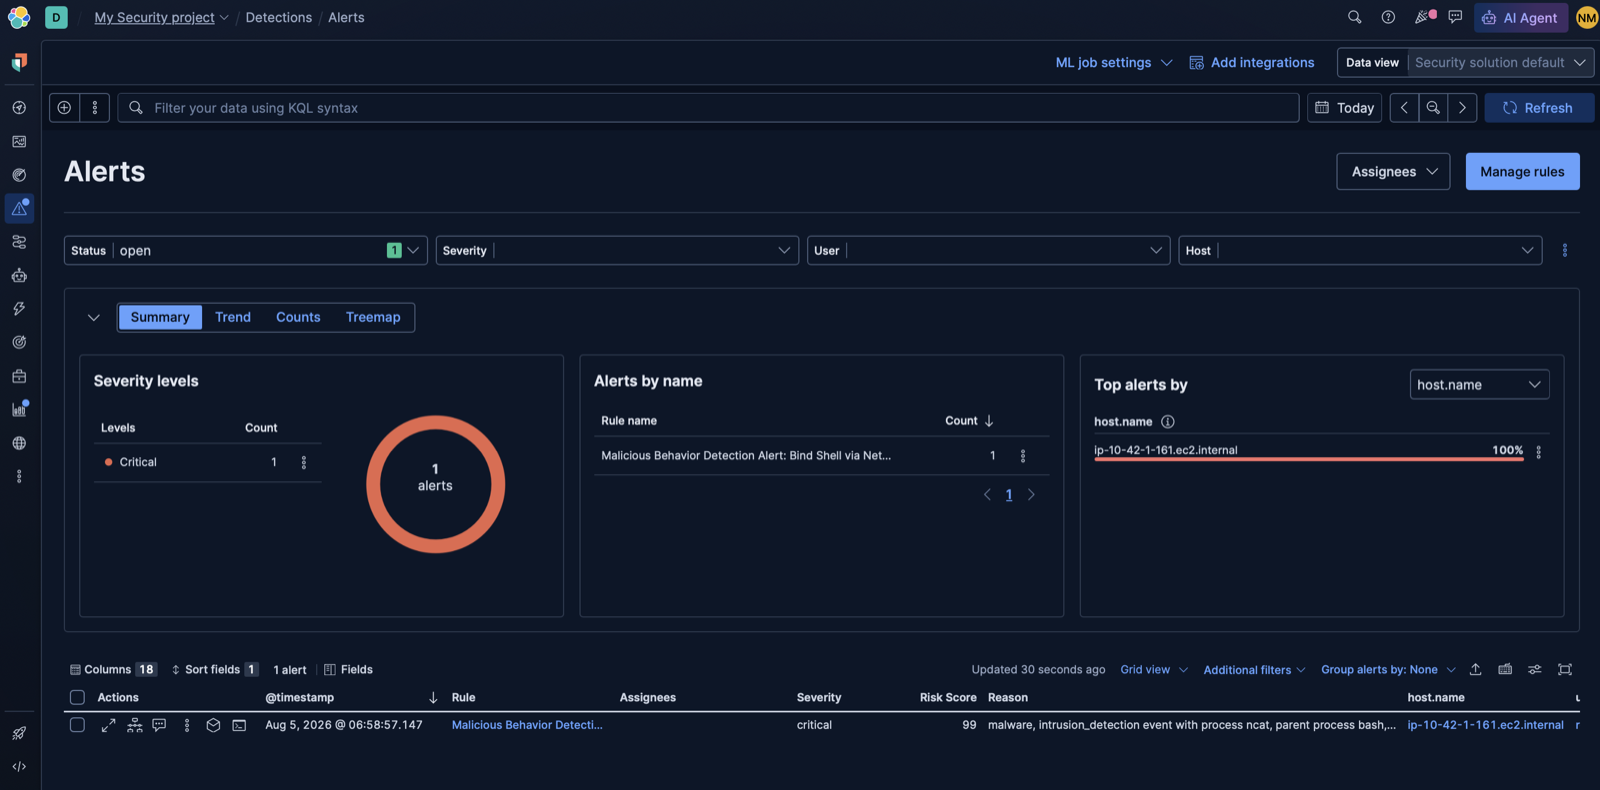

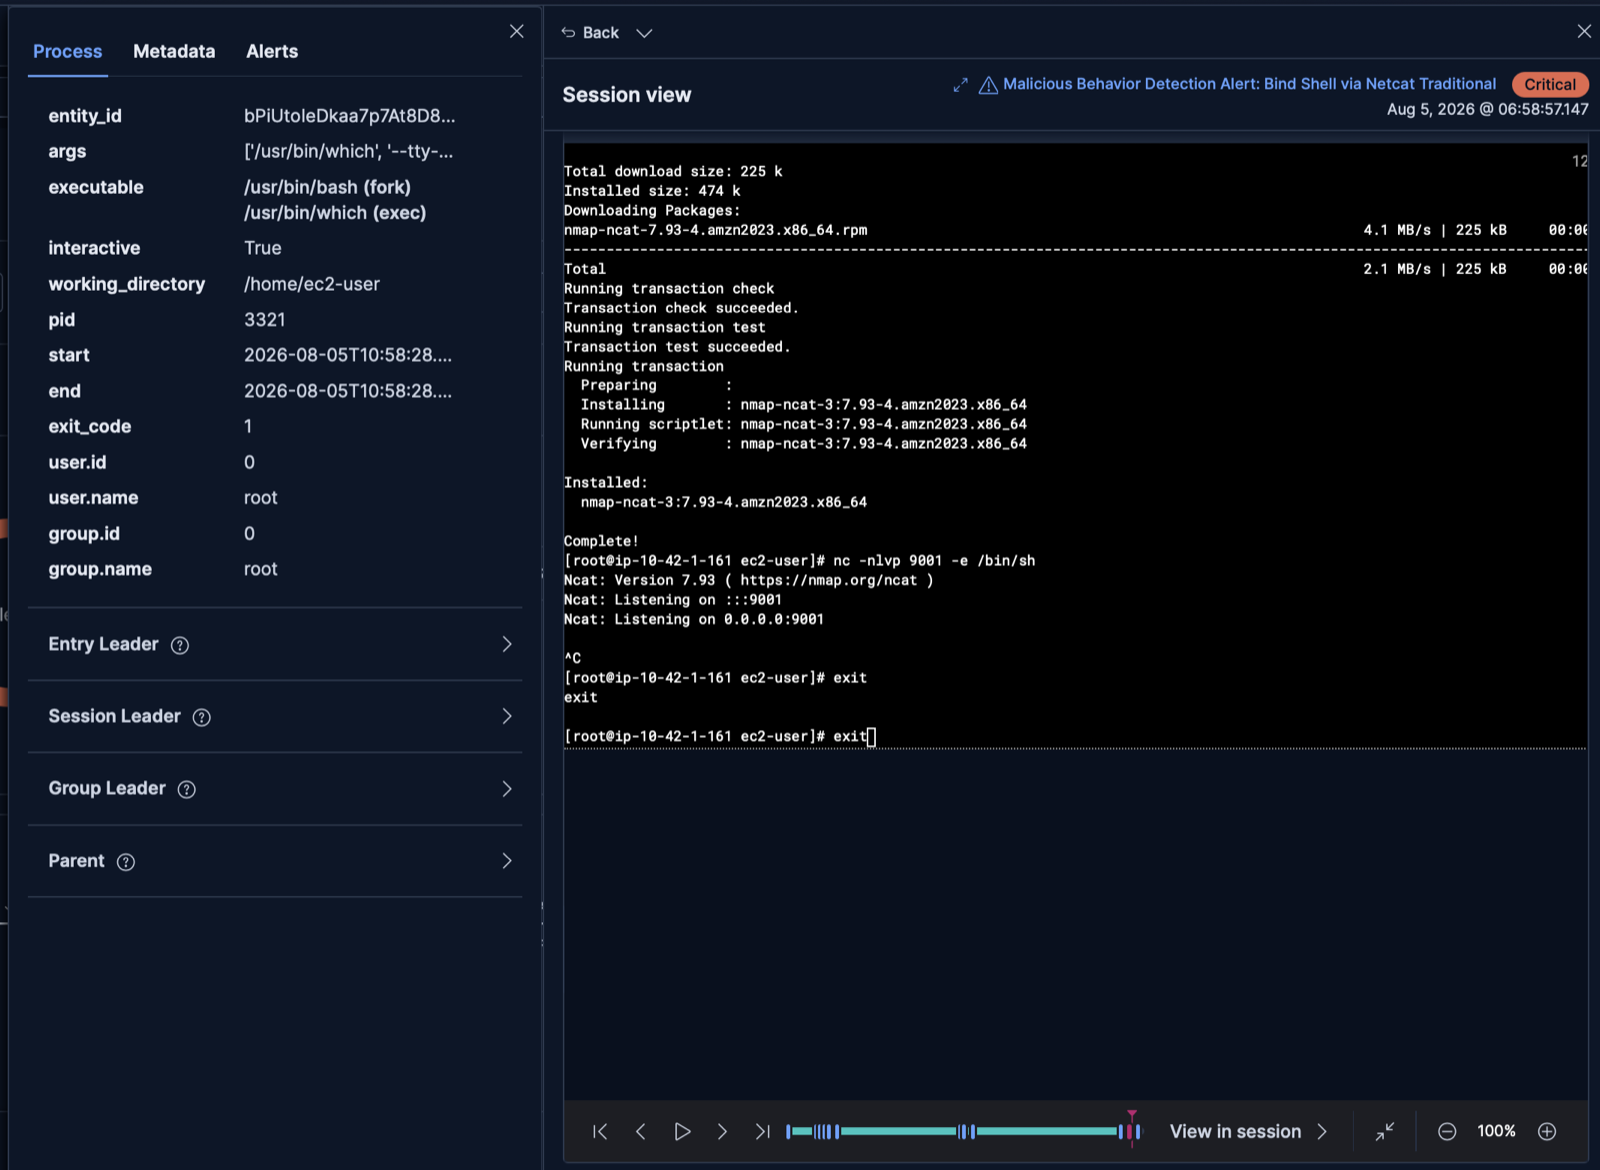
After running the bind shell, you can navigate to the “Alerts” panel, and right away this alert was shown: Malicious Behavior Detection Alert: Bind Shell via Netcat Traditional. Scrolling to the bottom, click on the “Open Session View” tab. This is where the fun begins.
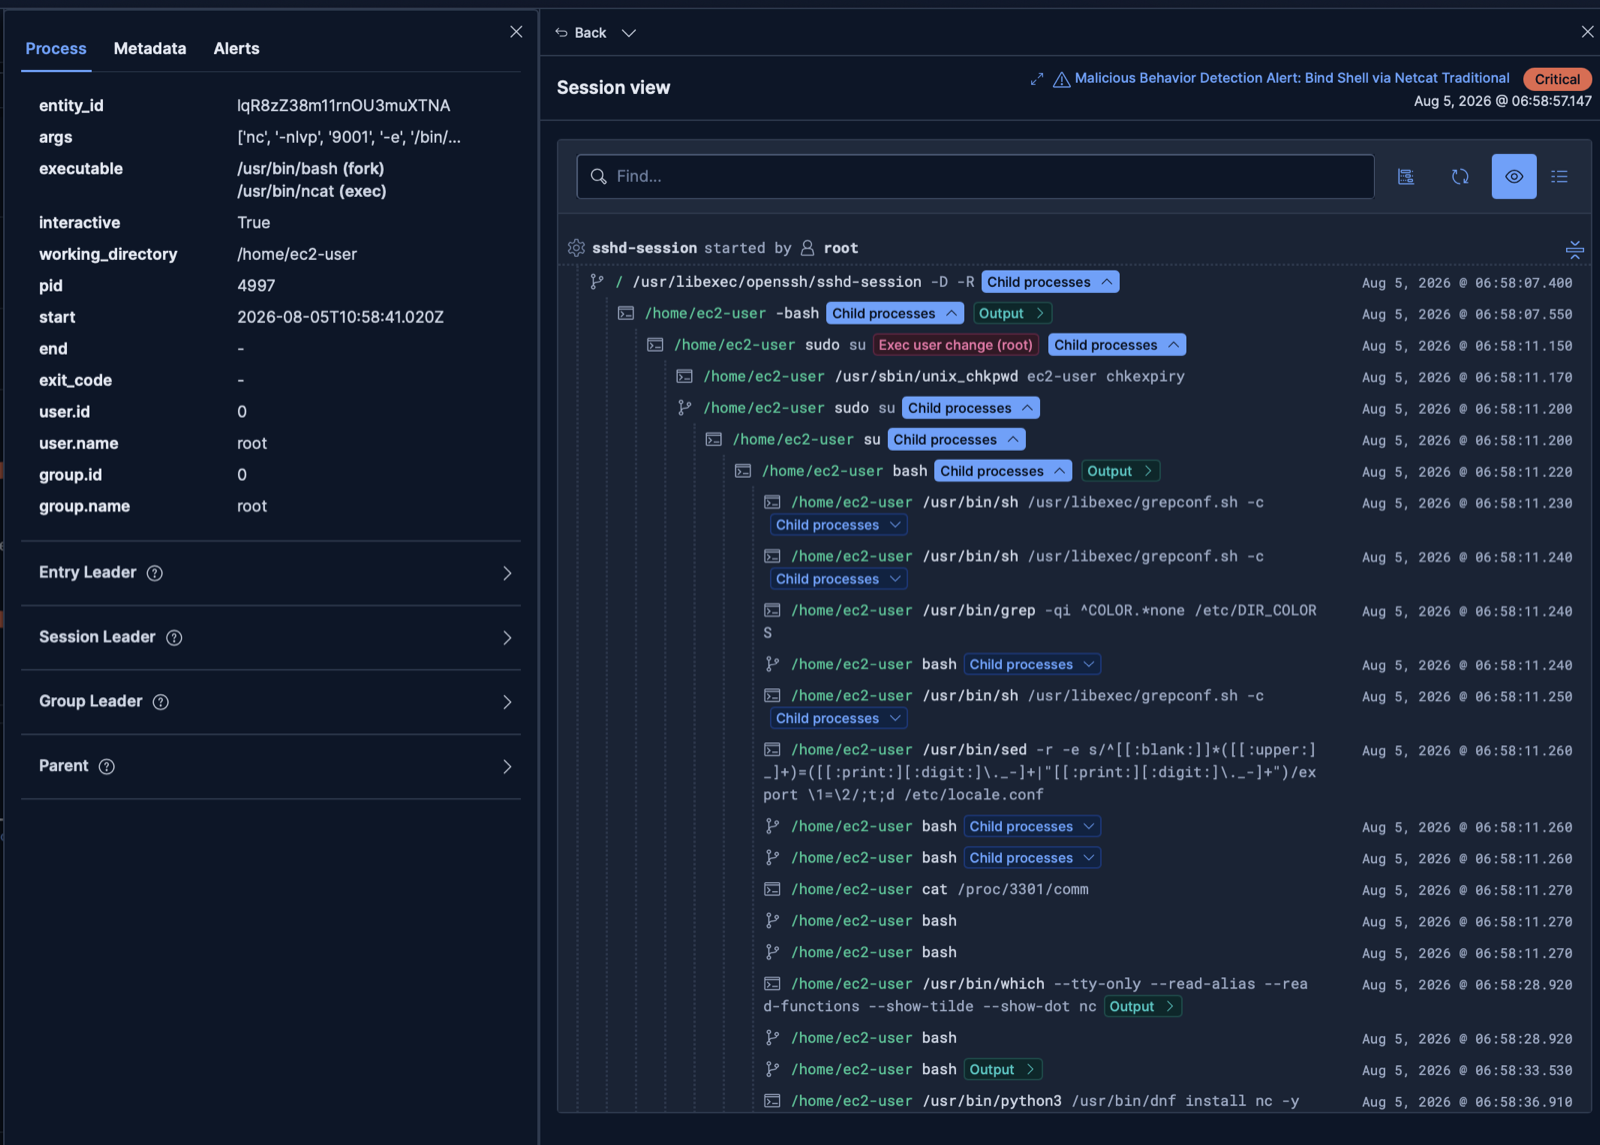
After clicking that, you got dropped into this session view. This session view works on quite a bit of hosts even older ones that do not have the full session replay available (older 4.x kernels). I think Elastic is stitching together all of the events by tgid, ppid, pid, cgroup, etc. Regardless, this view is pretty informative and show exactly what happened leading up to this event.
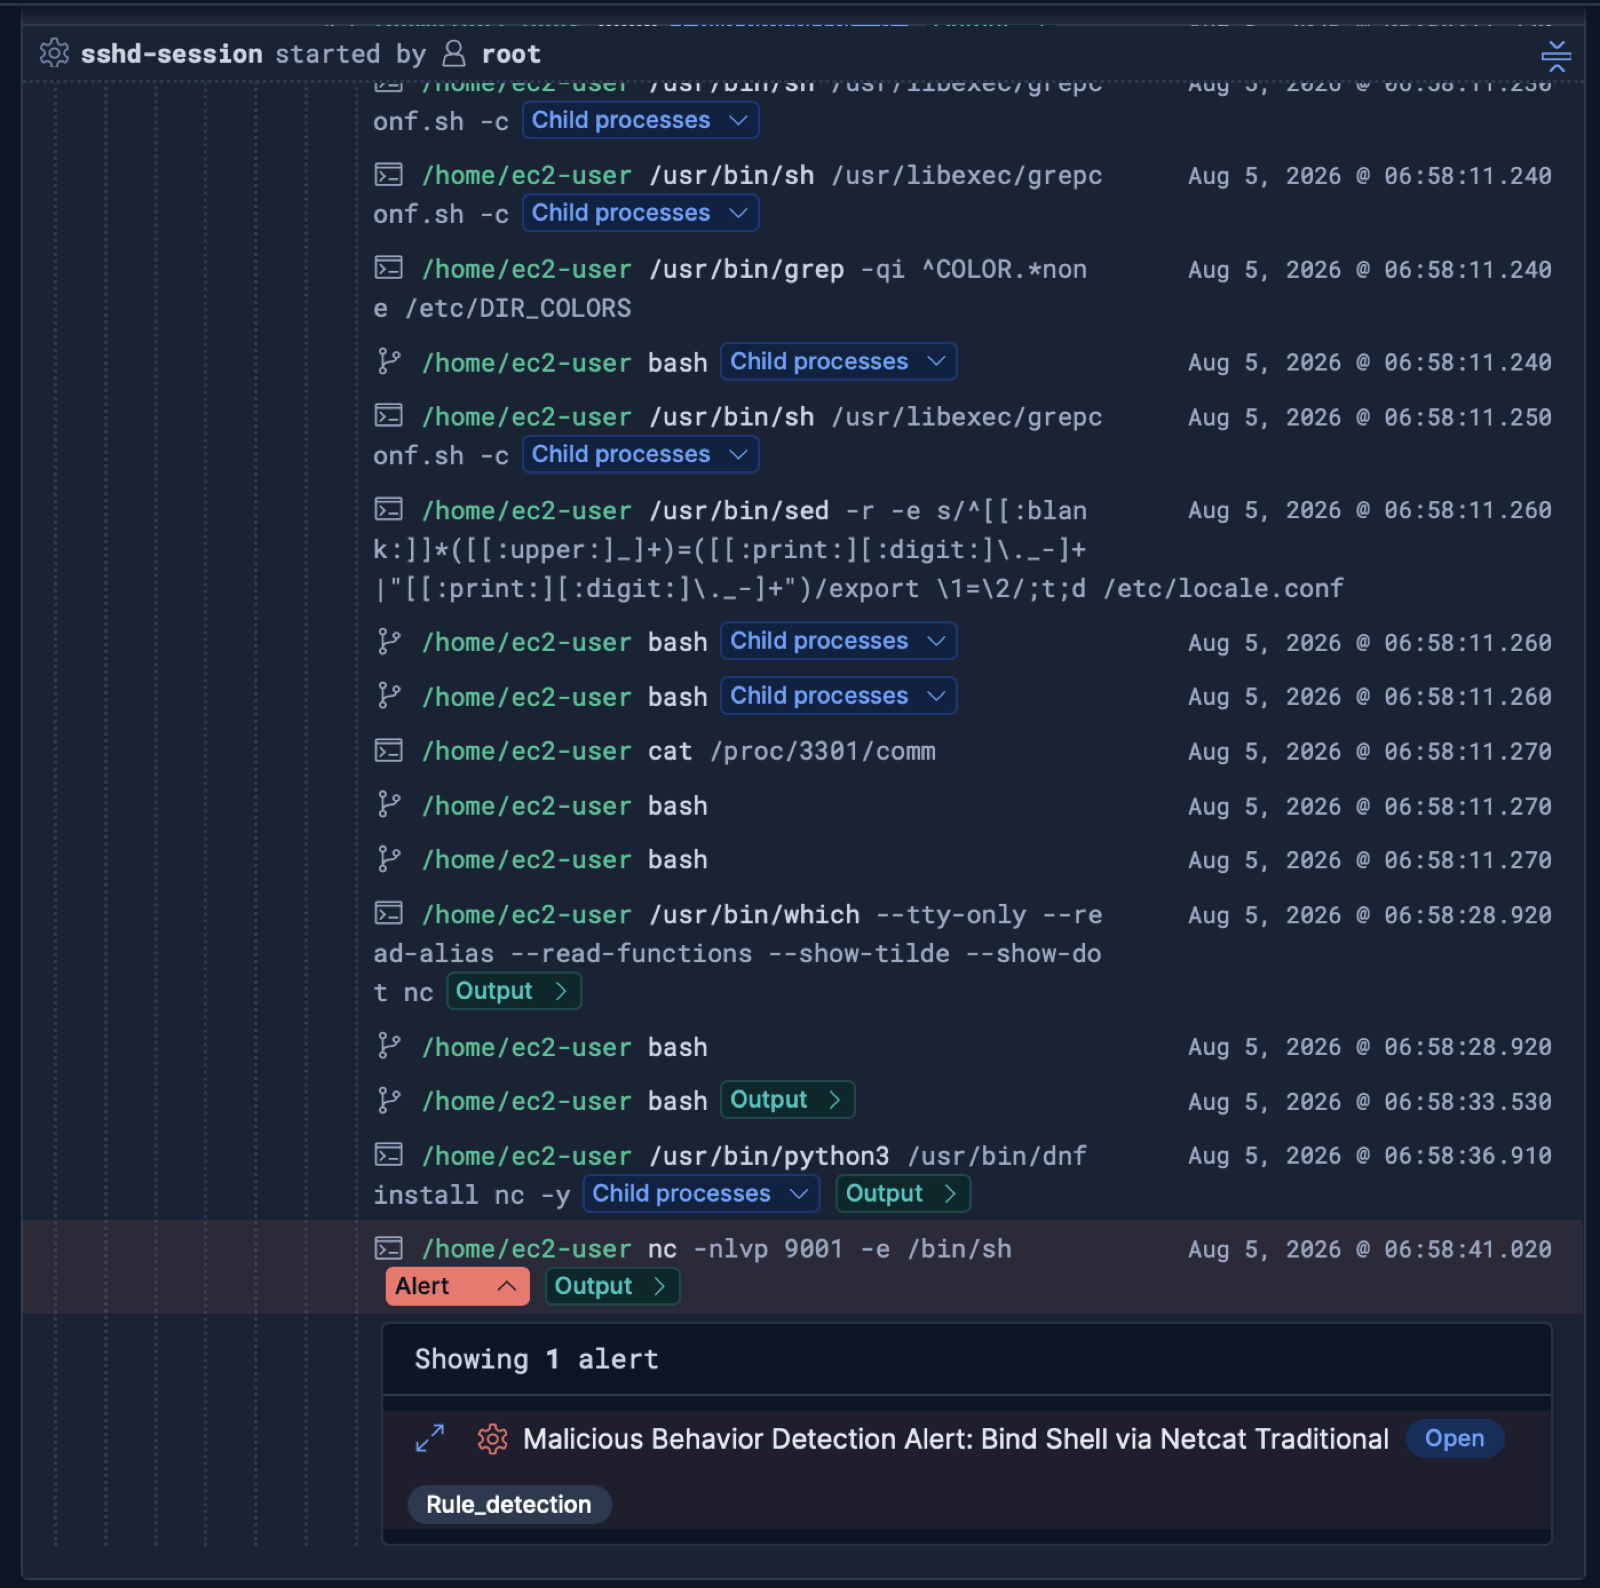
At the bottom you can see the “malicious” command being run, and the alert that fired along with it. Very helpful when performing an investigation. Here is a video showing the playback feature which does emulate the entire session including keystrokes/etc.
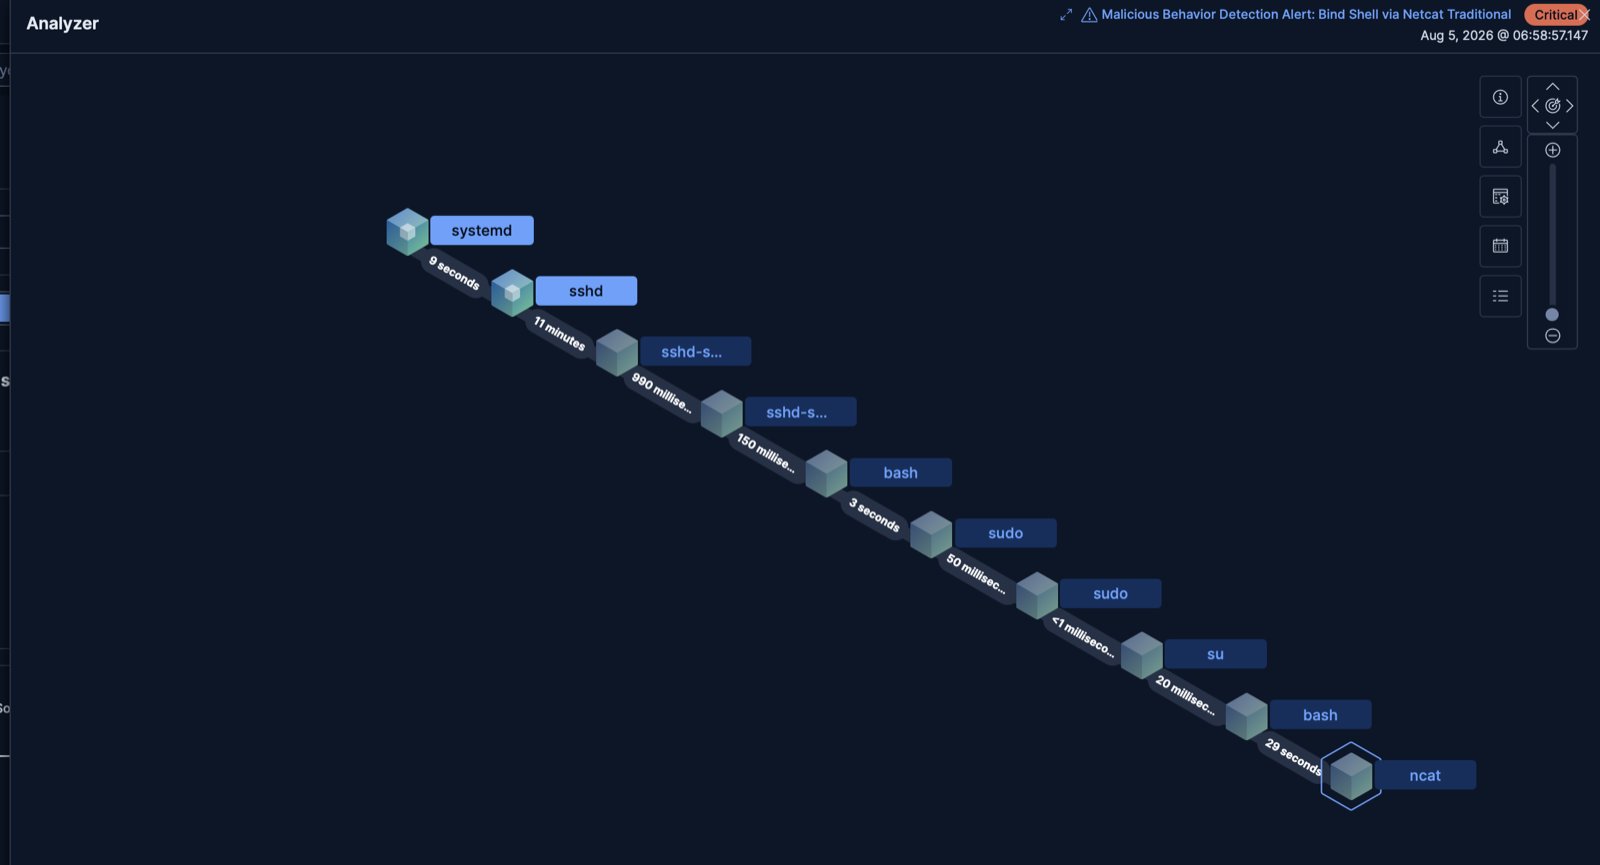
If you close out of that tab, and click the analyzer button, you get a similar view that details all of the parent processes/actions as well.
How does this work via eBPF?
So Elastic, like most sane security companies developing endpoint solutions, are using eBPF to interact with kernel level events. This is a much better methodology than writing your own kernel module or LSM. You can still utilize many LSM like features that the Linux Kernel exposes to various LSMs like AppArmor because eBPF allows you to hook into functions and obtain their calls/outputs (i.e. security_socket_bind). eBPF is considered a relatively stable way to interact with the kernel. The Kernel API itself has not had a stable history throughout eBPF’s existence, however past 5.10 most of the features/functions are well maintained, understood, and universal across OS flavors. If you want some more technical reading you can look at docs.ebpf.io.
Elastic’s eBPF code is open sourced as well, see the elastic/ebpf repo, under the GPL license (just eBPF code not userspace code). Modern eBPF uses CO-RE which basically allows you to understand where headers per kernels are at per machine, compile the eBPF code once, and then use it anywhere on most versions.
Process events via Elastic Defend are captured in Probe.bpf.c.
Here is a snippet of the start of the function that captures anytime a process execs. There is similar functions for things like fork.
SEC("tp_btf/sched_process_exec")
int BPF_PROG(sched_process_exec,
             const struct task_struct *task,
             pid_t old_pid,
             const struct linux_binprm *binprm)
{
    if (!binprm)
        goto out;

    if (is_kernel_thread(task))
        goto out;

    struct ebpf_process_exec_event *event = get_event_buffer();
    if (!event)
        goto out;

    event->hdr.type    = EBPF_EVENT_PROCESS_EXEC;
    event->hdr.ts      = bpf_ktime_get_ns();
    event->hdr.ts_boot = bpf_ktime_get_boot_ns_helper();

    ebpf_pid_info__fill(&event->pids, task);
    ebpf_cred_info__fill(&event->creds, task);
    ebpf_ctty__fill(&event->ctty, task);
    ebpf_comm__fill(event->comm, sizeof(event->comm), task);
    ebpf_ns__fill(&event->ns, task);
Userspace loads this compiled eBPF object file, and then is able to poll for results.
For TTY monitoring, eBPF is utilized here via these two functions:
SEC("fentry/tty_write")
int BPF_PROG(fentry__tty_write, struct kiocb *iocb, struct iov_iter *from)

SEC("kprobe/tty_write")
int BPF_KPROBE(kprobe__tty_write, struct kiocb *iocb, struct iov_iter *from)
The first is the more modern way to do this that is CO-RE friendly, and the latter is an older kprobe where fentry is not available (see the fentry docs, Linux Kernel 5.5+). Userspace does some fancy logic to detect what is available at runtime and use the correct entry appropriately.
Thank you for reading!